
What Metrics Should a Restaurant Review Every Week?
In the restaurant business, intuition is a valuable quality, but today it is no longer enough on its own. The smartest, safest, and most profitable decisions stem from clear, objective, and constantly updated data.
Reviewing key metrics on a weekly basis allows you as a manager or owner to detect problems early, optimize operations, plan purchasing, and increase profit margins without making drastic structural changes.
In this article, we will analyze in detail the fundamental metrics you should review every week to maintain real, professional control over the financial and operational health of your business.
1. Total Number of Reservations
This is one of the most basic volume metrics, but also one of the most decisive for measuring your brand's popularity and traction.
Every week you should analyze:
- The total number of guests and bookings for the period.
- The booking breakdown by day of the week (to identify critical services).
- A direct comparison with previous weeks and the same period last year.
- Distribution by time slots and shifts (lunch vs. dinner).
This will help you predict demand and plan kitchen purchases and floor staff with surgical precision.
2. Cancellation and No-Show Rate
Last-minute cancellations and, worse, no-shows represent a direct loss of revenue that cannot be recovered.
Metrics to monitor:
- The percentage of cancelled reservations relative to the total.
- The percentage of no-shows without prior notice.
- The days and times most prone to these incidents.
- The booking type or channel with the highest no-show rate.
If these rates exceed 5%, you need to immediately implement better automated reminders or reservation guarantee policies.
3. Restaurant Occupancy Rate
Occupancy indicates how well you utilize the physical capacity of your dining rooms and terraces during service shifts.
Review weekly:
- The percentage of tables and seats occupied per service.
- Table turnover (how many times a table is turned during a shift).
- Days and times with critical under-occupancy.
This analysis is crucial for designing promotions to boost off-peak hours and optimizing staff scheduling.
4. Average Ticket per Guest
The average ticket is one of the main drivers of profitability. Increasing the average ticket is usually much faster and more cost-effective than acquiring new customers.
Average Ticket Formula:
Total Revenue for Period / Total Number of Guests Served
Analyze weekly:
- Average ticket trends compared to previous weeks.
- Differences in average ticket between lunch and dinner, or weekdays and weekends.
- The impact of promotions or upsells suggested by floor staff.
5. Retention Rate and Repeat Customers
Customer loyalty is the greatest indicator of long-term success. Repeat customers are cheaper to attract, spend more, and act as ambassadors for your brand.
Compare weekly:
- The percentage of returning guests versus new customers.
- The average visit frequency of your repeat guests.
- Ratings and preferences associated with their customer profiles.
6. Reviews and Online Reputation
Your online reputation on platforms like Google Maps and TripAdvisor directly influences the booking decisions of new customers.
Monitor every week:
- The volume of new reviews received.
- Weekly average score and historical rating.
- Recurring keywords in negative comments to fix kitchen or service issues instantly.
7. Performance and Conversions by Booking Channel
Not all acquisition channels perform the same way or have the same operational cost.
Compare:
- Direct bookings from your website.
- Bookings received through your Google Maps profile.
- Manual bookings recorded from phone calls.
- The effectiveness of social media campaigns.
This allows you to focus marketing efforts on channels with the highest return on investment and lowest cost.
8. Cancellations by Time Slot
Understanding when cancellations occur helps predict behavioral patterns and adjust policies accordingly.
Identify:
- Specific shifts that concentrate last-minute cancellations.
- The average notice period guests give when cancelling.
9. Staff Cost vs. Revenue (Labor Cost %)
Staff is one of the highest operating costs. Measuring its weight against weekly sales helps you adjust scheduling efficiency.
Analyze:
- The percentage of weekly revenue spent on payroll and social security.
- Accumulated overtime and team productivity per shift.
10. Menu Item Popularity and Margins (Menu Engineering)
It is not enough to know which dishes sell the most; you need to cross popularity with the profit margin of each recipe.
Classify weekly:
- Stars: High popularity, high margin.
- Puzzles: Low popularity, high margin.
- Plowhorses: High popularity, low margin.
- Dogs: Low popularity, low margin.
Common Mistakes When Analyzing Metrics
- Not maintaining a consistent weekly review routine.
- Focusing solely on total revenue without analyzing the associated costs.
- Failing to compare data with previous weeks to identify trends.
- Ignoring what the data says and continuing to make decisions based on gut feel.
Conclusion
Reviewing metrics systematically is the difference between a restaurant that just survives and one that scales and thrives. Focusing on these 10 weekly indicators gives you a unique competitive edge to maximize revenue and reduce operational costs.
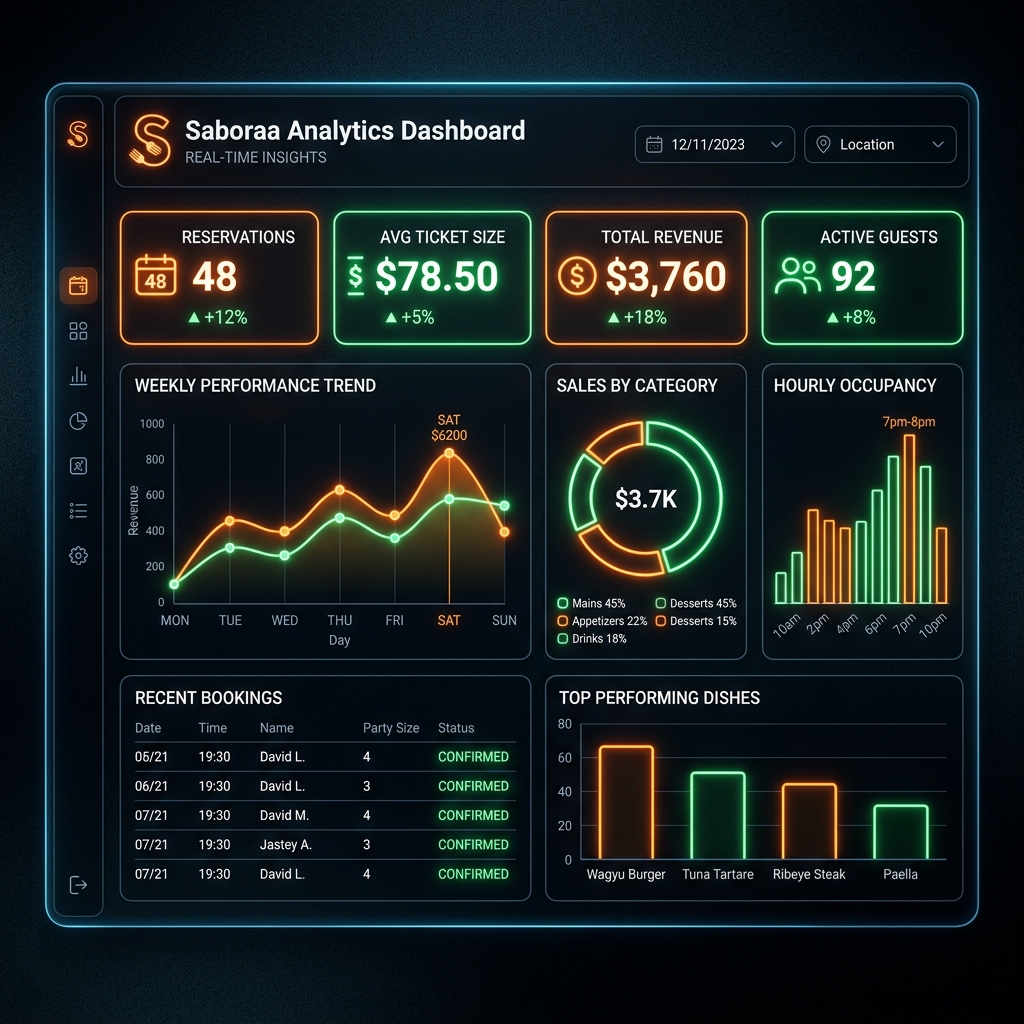
Track Your Metrics in Real Time with Saboraa
With Saboraa, you don't need complex spreadsheets or manual data gathering. Our platform centralizes all your business analytics:
- Real-time booking and occupancy dashboard: See your dining room status at a glance and anticipate staff workload.
- Cancellation and no-show metrics: Drastically reduce absences with automated email/SMS confirmations and track cancellation rates visually.
- Automated weekly reports: Receive performance summaries of average ticket, repeat customers, and channel popularity directly in your inbox.
- Integrated CRM: Learn the return rate of your guests and link their average ticket to their profiles for hyper-targeted campaigns.
Take control of your restaurant today. Digitalize your success with Saboraa.